In an era where developer efficiency is paramount, DevBox emerges as a game-changer. Offering not only competitive pricing and performance, DevBox grants developers the unparalleled freedom to operate on Desktop as a Service (DaaS) without the traditional administrative restrictions on utilities and extensions.
However, freedom must be balanced with security. To ensure a secure and productive environment, consider implementing the following configurations:
Essential Configurations for DevBox
Single Sign-On (SSO) to EntraID: Simplify access management and enhance security with SSO integration.
Device Management: Utilize Intune or other MDM/MAM solutions to track and enforce device posture.
Regular OS Updates and Patching: Ensure operating systems are consistently updated and patched.
Application Control: Monitor and manage potentially risky applications.
Standardized OS Images: Use corporate-standard OS images, incorporating necessary security utilities from the Azure Compute Gallery, and ensure regular refreshes.
Limit DevBox Count: Restrict the number of DevBoxes per developer to manage resources effectively.
Auto-stop Configuration: Implement auto-stop for DevBoxes during non-operational hours to optimize usage.
Network Deployment: Deploy DevBoxes within your organization’s network to enable access to corporate resources and allow network traffic inspection by corporate security devices.
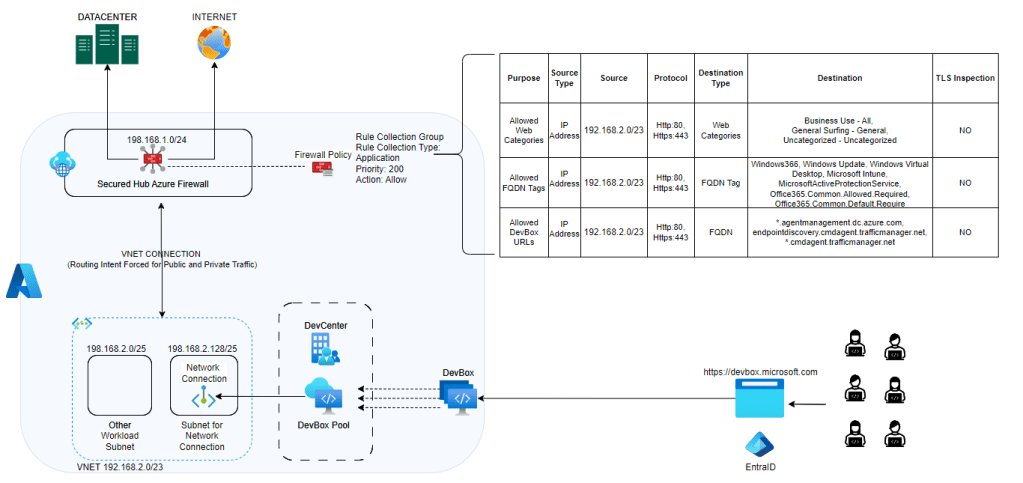
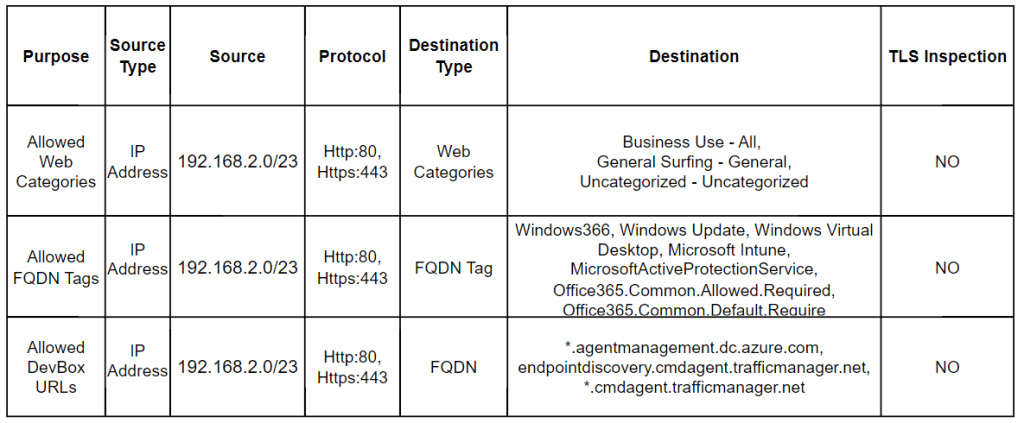
Guidance for Restricted Internet Connectivity
For secure yet flexible internet connectivity on DevBox, it’s crucial to configure your network correctly. Implementing SecuredHub, NVA, or any firewall device will disable public network connectivity by default. This ensures security without compromising developer productivity. However, to maintain the health of DevBox, allow access to its necessary URLs and service tags.
Configuration Patterns for Azure Firewall Policy Application Rule
Pattern 1: Using Azure Firewall in Secured Hub
Web Categories Whitelisting: Control internet connectivity by whitelisting specific web categories.
Allowed FQDN Tags: Essential for network requirements of DevBox and Windows 365. Without these, you risk unhealthiness, errors, or broken access.
Allowed DevBox URLs: Facilitate Azure Network Connection (ANC) health checks to prevent deployment failures or errors. Refer to [URL] for required endpoints.
Pattern 2: Traditional Virtual Network Hub
If avoiding exposure of Azure Firewall Public IP due to SNAT port exhaustion or other reasons, incorporate Azure NAT Gateway. This component handles public outbound requests, ensuring scalability and avoiding SNAT portal issues, while preventing exposure of Azure Firewall IP.
Embrace these configurations to leverage the full potential of DevBox, striking a balance between developer freedom and robust security. DevBox is not just a tool; it’s a revolution in developer productivity and operational efficiency.
Like in marketing management, 4Ps of Marketing by Philip Kotler has been ever green guiding principle, 4Ss seems going to be guiding principle in the world #GenAI driving coding.
If you are using #GithubCopilot, your AI companion tool that can help you write code faster and better, you might want to know how to create effective prompts that elicit accurate and useful responses from it. Here are the 4 S’s that you should follow when crafting your prompts:
Single: Write a clear and specific prompt that asks for one thing at a time. A vague or ambiguous prompt can lead to confusing or irrelevant responses from Copilot. Therefore, you should always state your task or question clearly and precisely in your prompt.
For example, instead of asking “How do I sort a list and print it?”, ask “How do I sort a list in ascending order?” and then “How do I print a list?” separately.
Specific: Provide clear and detailed instructions. This will help you get more relevant and accurate code snippets. For example, you should specify the programming language, the input and output formats, the expected functionality and any constraints or requirements.
For example, instead of asking “How do I connect to a database?”, specify the type of database, the language, the framework, the credentials method (not best practice to put secrets in code ), etc.
Short: Be specific but brief. Avoid unnecessary details that may confuse Copilot or make the interaction more complex. This way, you can communicate your intention clearly and get the best results.
For example, instead of writing a long paragraph explaining what you want to achieve, use bullet points or keywords to summarize your goal.
Surround: A good way to improve the quality of your code suggestions from Copilot is to use descriptive filenames and keep related files open. This way, Copilot can understand the context of your project better and generate more relevant code.
For example, if you are working on a web app, you can name your files according to the functionality or component they contain, such as login.js or navbar.css. You can also keep the files that are related to each other open in the same editor window, such as index.html and app.js. This will help Copilot to suggest code that matches your project structure and style.
Additional Guidance: Like Product Marketing, 3 more Ps gets addres for Service Marketing. 🙂 Similar to this, 3 more Ss i believe can help you further improving your prompt and your code companion Copilot.
Suggestions: Use suggestions to check and improvise. Once you have extension installed. It will show against your prompt output or auto suggestion.
Scope: Sometime it is better reduce the scope so that we solve specific problem.
Example: You may be writting complex loop function and need Copilot only to give loop function for subset of code block. In that case, select the piece of code subset followed by right click operate and operate on Copilot Options or CTRL+I (provide relevant prompt)
Shortcut Keys: Use keyboard short-cuts to reduce time on mouse operation and give more time on keyboard operation (Developer Mindset). Refer available Keyboard Shortcuts for various platform here My Personal favourity A+] (for next suggestion), A+[ (for previous suggestion), CTRL+I (for limiting scope)
By following these 7 S’s, (yes now 7S :-D) you can create effective prompts that will help you get the most out of Copilot. Happy coding!
AI is a powerful ally for content writers who want to improve and polish their writing. There are many useful tools and techniques that can help us evaluate and optimize our content quality and tone. One of these tools is Microsoft Word ‘Editor‘. It not only offers comprehensive feedback and suggestions for revision and grammar, but also gives us instant insights on how our content scores against key readability metrics such as Flesch Reading Ease, Flesch-Kincaid Grade Level and Passive Sentences.
You can learn more about how to use this feature in Word here:
Flesch Reading Ease scores This test rates text on a 100-point scale. The higher the score, the easier it is to understand the document. For most standard documents, you want the score to be between 60 and 70.
Flesch-Kincaid Grade Level Score This test rates text on a U.S. school grade level. For example, a score of 8.0 means that an eighth grader can understand the document. For most documents, aim for a score of approximately 7.0 to 8.0.
Passive Sentences This shows the percentage of passive sentences in your text. Passive sentences can make your writing less clear and direct. Try to use active voice whenever possible. Lesser that percentage better it is.
Snippet how can you can accces this in WORD with Editor Enabled.
Use Cases, but just limited to, where we can use this mechanism;
Document Writting of any type such as Authors, Bloggers, News Reporters, Students, Teachers etc.
Content Creation for any digital platform such as Customer Support dealing on Digital Platform like Chat Support, Social Media Handling etc.
Writing Content for any digital application such as Chat Bot, Website etc
A common theme in all of these use cases is the importance of concise and clear writing and content creation. This helps others to receive information and process it faster and more effectively.
In a recent testing endeavour, I had the opportunity to explore multiple topologies for a Secured Azure Network Hub Spoke deployment. The primary focus was on establishing stringent traffic control and inspection capabilities, particularly through the utilization of Firewall devices. However, the complexity increased as the objective expanded to encompass multiple HUBs across different regions. The ultimate goal was to simulate a typical enterprise deployment, enabling central firewall teams to enforce policies across the entire landscape while granting regional teams’ control and operational autonomy over their respective traffic through dedicated firewalls.
The project required careful consideration and planning to ensure the successful implementation of a secure and scalable network architecture. Here are the key highlights of this testing journey:
Traffic Control and Inspection: The foremost objective was to establish comprehensive control and inspection mechanisms for all types of traffic, including both private and internet-bound. Firewall devices played a critical role in achieving this goal, enabling granular policy enforcement and traffic analysis.
Multi-HUB Deployment: To mimic the complexities of a real-world enterprise setup, the deployment spanned multiple HUBs across different regions. This approach allowed for centralized control by the firewall team at the global level while empowering regional teams to manage and operate their respective traffic through dedicated firewalls.
Centralized Policy Enforcement: The deployment aimed to create a robust framework that enabled centralized policy enforcement. By consolidating the firewall management and configuration at the central level, the organization could ensure consistency and adherence to security policies across the entire landscape.
Regional Autonomy: Simultaneously, the design emphasized providing regional teams with the flexibility and autonomy to control and operate their traffic based on specific requirements. This decentralized approach allowed for efficient management within each region, while still adhering to the overarching security framework.
To streamline and accelerate my testing process, I utilized a combination of Terraform and GitHub Actions. Leveraging Terraform allowed for the rapid provisioning and clean-up of resources, contributing to cost savings. I have shared the patterns and corresponding Terraform and GitHub Workflow sample code in this repository
Virtual WAN Route Through NVA (or NVA in Spoke): This pattern utilizes Azure Virtual WAN capabilities and involves the use of a Virtual Hub. However, in this configuration, the Network Virtual Appliance (NVA) is placed directly in the spoke, adjacent to the Virtual Hub. Subsequently, the nested spoke peers with the NVA VNet. The key advantage of this pattern is that customers can continue using their standardized NVA Appliance alongside Azure Virtual WAN’s global connectivity. It’s worth noting that Azure Virtual WAN now supports SaaS ISV integration within the Hub, as well as the inclusion of various third-party NVAs within the Secured Virtual Hub (Secured Virtual HUB refers to a Virtual Hub with a Firewall Device inside it, where the Firewall Device can be Azure Firewall or a supported third-party appliance).
Virtual WAN Routing Intent: Secured Virtual HUB has been available for some time now, and with the introduction of routing intent, certain limitations have been addressed. Routing intent empowers organizations to establish simple and declarative traffic routing policies. In other words, it enables defining which types of traffic should be controlled via the Firewall. An added advantage is that it supports cross-region hub traffic, allowing for efficient management of network traffic across different regions.
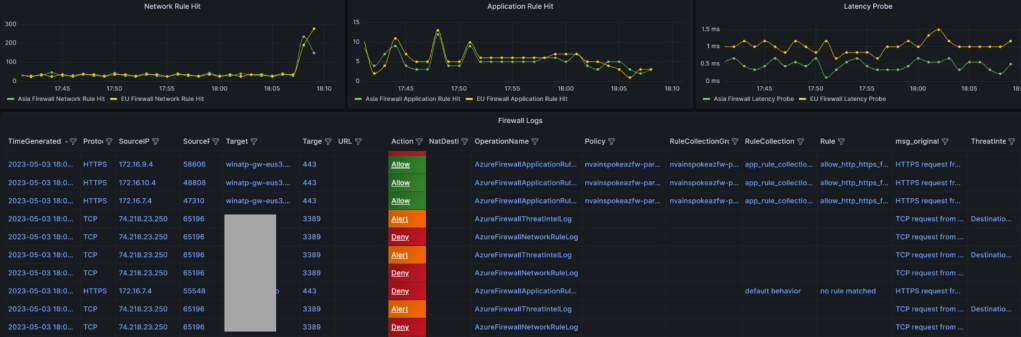
Getting a Single Pane of Glass View Across the Landscape: Command Centre View: During my testing process, I encountered the need to review Azure Firewall Logs across multiple Azure Firewall instances in different regions. To address this requirement, I adopted a two-step approach:
Enabling Diagnostic Logs using Azure Policy: To enable diagnostic logs on Azure Firewall instances, I utilized a custom diagnostic policy built by Azure Landing Zone. This policy facilitated the activation of diagnostic logs for various Azure resources and ensured their transmission to specific Log Analytics Workspaces. You can find the policy initiative here:(Github Reference here). For guidance on using this policy outside of the Azure Landing Zone construct, refer to this documentation (Github Reference for Custom Policy).
Dashboard creation using Azure Managed Grafana (Guidance ): To visualize the logs that were landing in the Azure Log Analytics workspace, I leveraged the capabilities of Azure Managed Grafana to create a comprehensive dashboard. Considering my perspective as a member of the NOC/InfoSec team, I focused on key metrics and log visualizations that would be of interest to customers. The following are the key metrics and log streams I aimed to include:
Application Rule Hit Count Across Firewalls: Since I was utilizing the Azure Firewall Parent-Child Policy concept (Base Policy and Child Policy), I wanted to observe the near real-time pattern of rule hits during testing. This allowed me to assess the effectiveness of the rules being applied.
Network Rule Hit Count Across Firewalls: Given that I was testing communication between spokes within the same hub as well as between spokes in different hubs, I wanted to gauge the metrics related to network rule hits across the firewalls. This provided valuable insights into the network traffic patterns.
Latency Probe Across Firewalls: Monitoring latency becomes crucial when operating under a secured environment. It is essential to keep a close eye on any latency probes that exceed the normal thresholds. By monitoring latency, I could identify potential performance issues and take proactive measures.
Log Streaming with Key Indicators: While log streams can be overwhelming with textual data, adding eye-catching indicators can enhance their visibility. This is where Grafana Thresholds proved to be useful. By configuring the dashboard to display indicators for alerts, deny, and allow, I could quickly identify important log lines. Furthermore, I designed the column sequencing in a way that allowed me to capture the required information at a glance. Regular dashboard refreshes in Grafana ensured that I had up-to-date information.
Final Sample Visualization (refer repo mentioned above for JSON file for dashboard in Grafana and Respective IaC Code)
Note: Similar dashboard can be built using Azure Workbook. In fact, in some case Azure workbook comes out extremely power and offers amazing visualization/resource linkage (with even Icon/tree etc.). May be as next iteration, I can build and publish for Azure workbook too.
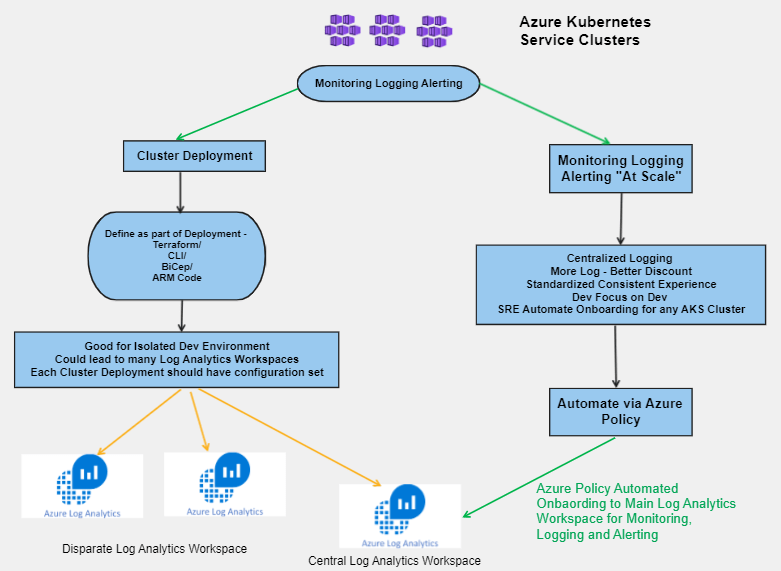
Azure Container Monitoring for Azure Kubernetes Services (AKS) is a vital aspect that varies from one deployment to another. Although enabling AKS Diagnostics Settings and sending logs to a Log Analytics Workspace might seem like enough, there are still a few moving parts to consider. In this blog post, we will discuss the importance of Container Insight and how to automatically and efficiently onboard it for any cluster.
First and Foremost, let me put ways of monitoring AKS Cluster and it’s component;
Container Insight (Workload Metrics/Logs)
AKS Control Plan Logs (Diagnostics Logs)
Prometheus Logs (New Offering)
In this post, I am going to cover `Container Insight` using Azure Monitor Agent (AMA). It is recommended that any AKS cluster should have it deployed as must, best practice. To deploy this, you need;
Log Analytics Workspace where you will send logs/metric to
User Managed Identity (Best Practice for Remediation Task) , Else System Assigned Managed Identity
Enable Add-On for Monitoring (Azure Monitoring Agent Container)
You can onboard any cluster with Container Insight as part of deployment by using a provided configuration. Alternatively, you could use Azure Policy to do it for you. In this blog post, we will show you how to automatically and efficiently onboard Container Insight for any cluster, using standardized configurations.
This is a personal experience sharing post that will provide you with practical insights on how to get started with Container Insight for AKS cluster monitoring. Don’t hesitate to take advantage of this best practice and ensure the performance and health of your Kubernetes cluster and container workloads. Also, please feel free to add your comment. Please note, technology keep changing at rapid pace. Don’t be surprised we shall have better alternatives.
Coming blog posts, I may cover following topics;
AKS Monitoring using Managed Prometheus and Managed Grafana at Scale
AKS Diagnostic Monitoring at Scale
AKS all Monitoring using ALZ Terraform Module Custom Policy Extension
How to have AKS Enterprise Wide Dashboards for Central Monitoring
Finally, ‘monkey off my back‘, CKAD done. I shall not boast that I could clear in 3 or few weeks of preparation. In fact, I started preparing for this since December last year (2020). Having business as usual activities, balancing between priority items for business vs learning is sheer art (we called it “time management”).
Good part is that i cleared it in my first attempt. I actually started preparation for CKA and somehow due to busy life and in middle of practice, i deviated my whole focus on yaml side of word. Later realized that my preparation became CKAD heavy. Thus, i decided to attempt CKAD first than CKA because i found myself more comfortable with K8 development than operation because we all are living in cloud world. We don’t build K8 cluster most of the time, we are operating and developing on top of it.
Some of my learning method and tricks are mentioned below;
Getting Familiar with Shell Script: There are plenty of tool and extension available which can make life easy while developing K8 in environment but remember in exam you will not get those tool/extension. Only thing you have to develop and execute is ‘vim’ or ‘nano’. So, if you are not going to get development IDE in exam, then there is no point of using those during your exam preparation.
Get Hands Dirty: This is not Q&A type exam. There is only one way you can crack it if you know how to execute on given lab environment. Therefore, there is no alternate to hands-on-labs. Get familiar with concepts but if you don’t practice, nothing will help.
Speed Against Time: 2 hours, you will 16-19 challenges. If you are not familiar above two, then things will not be favourable. Weightage base question play major part in your success but don’t get bogged down by weightage only. Trick: Do First Round in Sequence, what comes on the way (sequential). Attempt-Solve-Stuck-Make note of Question Number-Move Ahead-Round1 Done-Come Back to Note Down Question, if time permits. Doing this trick, you may get some easy one which will have decent weightage; thus, you don’t waste major time.
Read question thoroughly and Store Yaml Smartly: For different challenges you need to write yaml file from scratch, check challenge where to store final Yaml, where to store output. If you are stuck in some challenge and you need to revisit it again, how will you know which Yaml file belong to which challenge because you will have many files by that time. Trick: Name Yaml file based upon question number. So, i name them like q12.yaml. Thus, if I have time left to revisit. I go to my note check Q12 is left. I go to Q12.yaml and start working from there. Time saved in going back and forth. Organize yourself during exam.
Kubernetes Doc is your best friend: If you have done all first two things mentioned above, then I assume that you will eventually become friend with Kubernetes documents. Some section of K8 docs will give you full end to end answer like POD with Persistent Volume and Persistent Volume Claim. Deployment Roll Out, ConfigMap with Volume etc. I read may learners shared that they bookmarked many sections and use those during exam. Ok for them, but I did not find much use as time is limited and single browser session is only allowed. I rather get familiar what key word to put in K8 doc based upon challenge type. Thus, understanding of K8 basics is critical.
Imperative is winner: In time base exam, Imperative commands are winner or call them ‘trump card’. These all command are golden repository and will help tremendously Kubectl Reference Docs (kubernetes.io). Make yourself familiar with all of them.
Shortcut are time booster: Alias will play major role in saving your time in writing long statement. I did not use many but use few and practice them many times in my preparation;
alias c=clear
alias k=kubectl
alias kd="kubectl describe" <kd po xyz or kdl pod/xyz as pod/xyz can be copy paste from kga output>
alias kdl="kubectl delete --force" <kdl svc xyz or kd service/xyz as svc/xyz can be copy paste from kga output>
alias kga="kubectl get all" <help getting single pane of glass visibility and allow to copy paste thing for kd, often use kga -o wide (for IP and additional details) or kga --show-labels (for label mapping)>
alias kns="kubectl config set-context --current" <very critical as things will be in different context or namespace, kns --namespace=xyz>
alias ktmp="kubectl run tmp --image:nginx:alpine --restart=Never -rm" <use to quickly validate if things working fine, ktmp -l app=sample -i -- curl svc:8080>
Validate your work: Don’t just solve challenge and rush to next question. Validate if response were right using tmp pod etc. Control your excitement and be critical about your solution.
Have a mentor: Discuss with technical topic who has cleared this exam prior. Understand his experience, his logic on commands etc. Definitely, there will be area where you will have confusion or not clarity. Forums are another good way to get those clarified but better if someone personally with whom you know and can discuss topic. CNCF offer mentorship program also
Failure is learning: We learn best from our failure. CNCF offers two attempts under single coupon code. So, even if you are feeling bit less on confidence, there is no harm going for attempt and check where do you stand, so that next time you can come strong more prepared. In my case, I cleared in first attempt so I did not require 2nd attempt but yes, I was equally worried if I can make it in first attempt. My mentioned keeps on pushing me that go for exam and get familiar yourself. I use other way where I attempted various mock exam such lighting lab from #KodeKloud in prescribe time, killer.sh labs were super helpful and are must.
Group Study: If you find some study group, then it can be major booster for your preparation. I participated in my company CKAD Learning Sprint Study Group where organizer brought in speaker who has expertise on K8 or cleared this prior. Hearing practical insight, technical session and solving challenges given by them were super useful. You can find many such study group in your company, meetup or even you can initiate such group yourself.
How cool is Azure Logic Apps, we all know. Building automated workflows without writing a single line of code (or almost negligible) is simply amazing. Out-of-box connectors make it enterprise grade solution such that we can invoke unique flow based upon business logic based upon feeds coming from different system. These different systems can be B2B, SaaS Products, basically provide Enterprise Integration Pack with Logic Apps following Industry standard around Electronic Data Interchange (EDI)/ Enterprise Application Integration (EAI).
Logic App is Platform as a Service. We don’t need to worry about base environment like OS/Patch/availability etc.
Recently, I have concluded major project where we used intensive capability to automate various business flows. These flow can be as simple as writing all incoming sales enquiry to azure storage blob or creating service request for any specific type of incident scenario reported by Azure Log Analytics etc. I’ll try to cover scenario below, how we overcome, what were key observation.
Requirement: Due to security compliance all Azure Storage Account were Private in nature. Thus, they can be accessed only via Private Link (through Private Endpoint). On-Premise system can send their feeds to Read Blob Container via Hybrid Connectivity Established. But, how will we process feeds getting written in ‘Read Blob’. Logic App by default does not sit on VNET. In any circumstance, we can not take either storage account or logic app outside of same geography.
Solution: In May 2019 Integration Service environment (ISE) was being launched. Using ISE, Logic App can be easily be brought inside VNET vicinity. Thus, can allow to consume or interact with service or environment which are behind firewalls rules or private Endpoints. ISE, basically provision LogicApps inside a VNET Subnet.
Observations: Few of key observations;
ISE takes sometime to provision. Don’t get impatient, behind the scenario Azure is provision a lot of service and connectors so that specific LogicApps can operate with ease.
ISE will require as VNET and minimum 4 dedicated Subnet. (Review Azure Document before going ahead). Plan is well ahead. You can not mix up this subnet with anything else because these are managed subnet thereafter.
ISE will required integration service account to be provision for the service you want to connect example: Blob will require Azure Storage Integration Service Account etc.
ISE has it’s own cost. Run your simulation on Azure Calculator Prior. Study well and use ISE only as last resort. Sometime, solution such Managed Identity etc. or moving LogicApps to different region can help solve.
ISE can give you extension to your on-premise system via ISE Connector example: a LogicApps to be invoke based upon any Sales Invoice Process inside SAP running on-premise.
Scenario I tested;
Existing On-premise system were drop log file inside private blob. Soon after file gets drop, LogicApps needs to trigger and fetch file from Read Container–> Sent Email Notification–>Create New Blob in Write Container –> Notify Subscriber on file data parameters.
Twist was Private Storage Account. So as I described above, LogicApps with ISE was being provisioned. Normal LogicApps could not reach out to Private Blob (Using Managed Identity there is still an option but it may not full fill enterprise requirement of providing connectors).
With ISE, LogicApps can read Private Blob Container via Private Link Service provisioned.
Private Link DNS configuration, which gets provisioned.
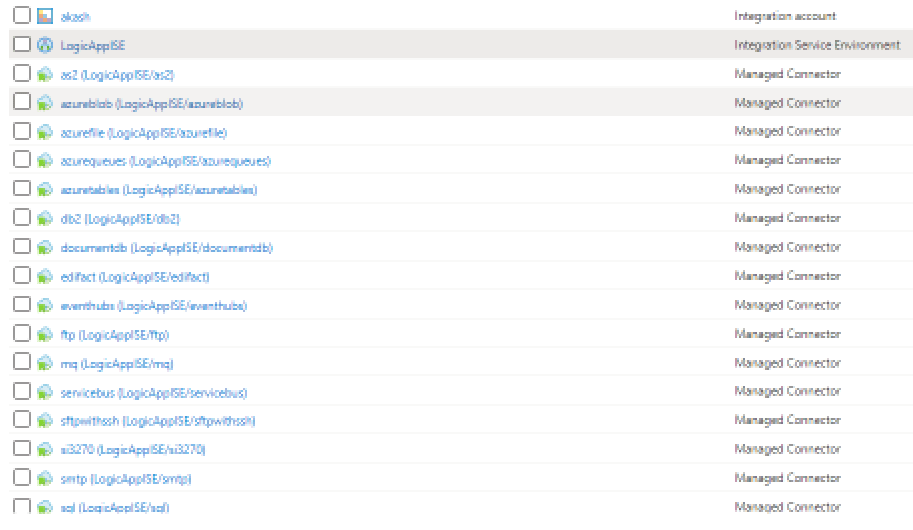
ISE can be seen added to LogicApps
Integration Account in ISE for Logic App calling
Azure Blob API connection
Managed Connector started Showing
Empty Subnet for ISE: 4 dedicated subnet required to be available for ISE.
Email Notifications for both read and write operation via LogicApp from the Private Blob Container
At last, ISE is interesting feature. It should be evaluated well and executed. Unlike Function (which runs on top of App Service) LogicApps can only be integrated to VNet using ISE. If there is stronger need, use it. It is cool.
Recently I have been working on a solution where specific application requirement sub-millisecond latency between tier workloads. At the same time, there has been a need for redundancy to ensure High Availability (HA) or Fail-over is being taken care of. Since Hyperscallers (AWS first to start then Azure followed recently and GCP had it natively and another cloud provider) has come up with Availability Zone (AZ) based (Software Define Networking (SDN) which connect different site within the same city or proximity) offering, solutions are being design taking it as defacto HADR solution.
While AZ is a cool feature and gives us flexibility and mitigate risk/cost of running parallel environment across different location, there are still some minor level things which are often being ignored. Some of those observations, I believe are following;
AZ is never a native HADR solution, it is us who treat them as HADR
AZ operate within the vicinity of city boundary (generally), which mean the environment is still exposed to a single point of failure.
By Placing workload across AZ, we only add extra latency within the landscape because the request is hopping across different sites.
Different Hyperscaller operates AZ differently, thus automation will be difficult to unify. Example: AWS AZ can be dictated by Subnet within VPC, GCP AZ can be dictated by Subnet but their VNET span across the region, Azure AZ cannot be dictated via Subnet within VNET.
So thought of checking it, actually how workload behaves in a different tier or different scenario behave. I choose platform as Azure to test as Azure is the latest entrant in AZ concept and very recently they have also come up with Proximity Placement Group (something similar to AWS Placement Group). Here are some of the findings when I performed basic PING Test across;
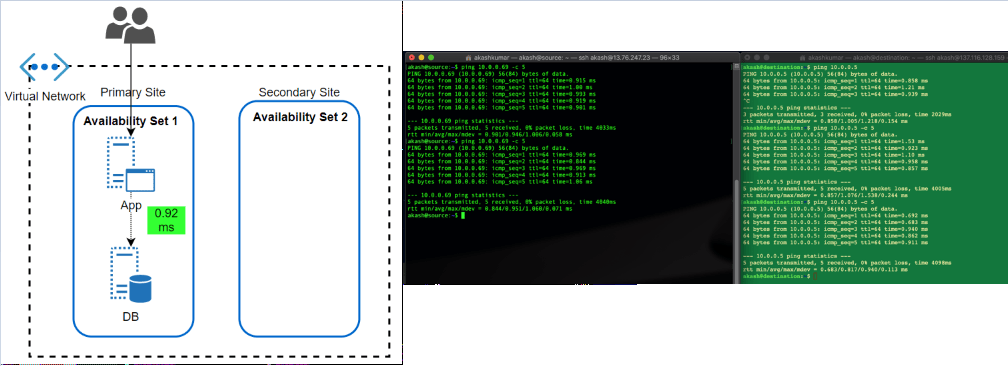
Availability Set: This feature has been almost since the inception of VM in Azure offering. An Availability Set is a logical grouping capability for isolating VM resources from each other when they’re deployed. The main purpose is to ensure workload run across different physical servers ‘with-in’ same datacentre and no single point of failure at the physical facility side.
The feature has been great in overcoming automatic updates, when they pushed or if Microsoft itself want to update something at Fabric level. Since the environment get restricted within a single physical site, the performance of workload, in terms of latency, has always been better.
After the launch of AZ, what I can’t find if workload protected by Availability Set, spread across different AZ automatically. Because neither we get an option to choose AZ when opting for availability set nor subnet within VNET allow them to define as per AZ.
Latency Test Results: A workload running in two different subnets but part of an Availability set, talk within 1 ms (average 0.92ms, I found in my test)
Availability Zone: Availability Zone has been introduced by Azure in approximate 1 year back. In my opinion, it was a feature which is yet not fully available across all region but Microsoft is working rapidly to offer it across all offered region as well as mature this offering itself (check my next section why I am saying this). I believe that competition has caused a lot of damage is gaining market by marketing AZ while ‘Region Pair’ (Azure way of HADR, which I believe is true DR) did not work out in price & operational sensitive market.
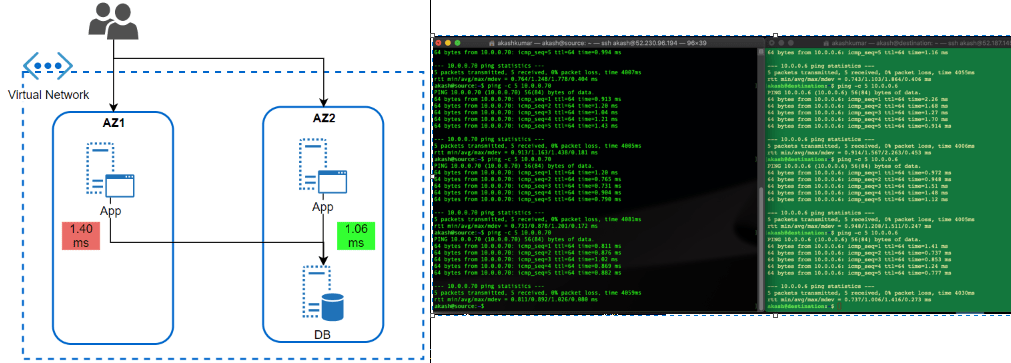
AZ should be treated with case (if someone coming from strong AWS background) because it is being operational a bit different. Here Workload is to be dictated which AZ, it should sit. Virtual Network’s subnet span across AZ’s in the region.
I wanted to test how much latency does it take for a workload running in AZ to different AZ. This is a very common scenario of workload when APP tier Server is operated across different Azs and DB too. But, DB (RDMS) are single write tier, all queries to write should to a DB instance-specific running in AZ specific.
Latency Test Results: Workload talking across AZ is talking almost 0.40 ms more than workload running (1.40ms) within the same AZ. While the difference is not much, but think differently. It is almost 40% delay than within AZ, what if transaction getting processed together by users operating in sessions together in both AZ’s App tier workloads. It would cause some issue. Same goes with the very latency-sensitive workload. What is more interesting that I could not find any hyperscaller giving any commitment to latency between AZ. Thus, it is the architect problem to solve it before it becomes bigger problem post-production.
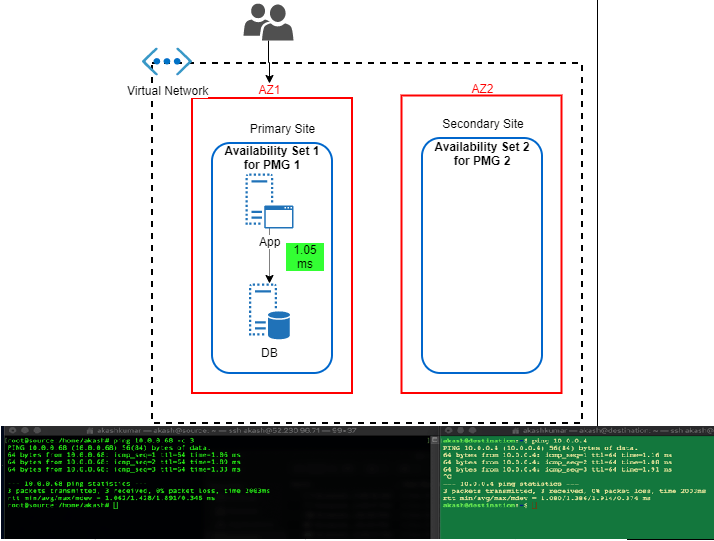
Availability Zone with Proximity Placement Group: Availability Set has been the well-proven solution to bring redundancy within DC, AZ has enhanced it to bring additional level redundancy within the region, still there were some open areas where thing was to be looked such that balance is being maintained between performance and redundancy.
I believe couple of month only back Azure has come up with Proximity Placement Group. It is quite cool feature because it tries to bring best of both (from above) i.e. Availability Sets and Availability Zones. We can hook any existing Availability to Proximity Placement Group (PPG), thus we can drive deployment to AZ specific. In this case, we’ll have different availability set with PPG for each AZ. I found KB article by Microsoft focuses a lot on using PPG in specific to SAP landscape deployment. It is quite relevant for such legacy type application which sensitive to the nearness of different tier. Only glitches (I am sure soon it will overcome that) these all operation are to be done via PowerShell scripting and well planning should be in place before execution.
Latency Test Results: In this case, performance definitely picked up. It hit on average 1.05ms
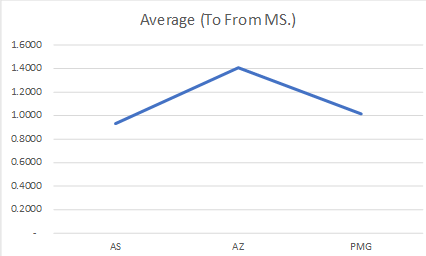
So here are the final summaries result of test;
Latency Scenario
Source to Destination (ms)
Destination to Source (ms)
Average (To From ms)
AS
0.9485
0.9110
0.9298
AZ
1.4280
1.3860
1.4070
PMG
0.9777
1.0545
1.0161
Overall Results
Final Analysis
In the end, I want to say what I have shared above was just thing which I wanted to see by myself and have a number attached to it. Thus, I can see how different it can make. Seeing these test result, things are much clearer to me and when I went for solutions specific problem, these pointer can be a guiding principle to move ahead.
I am firm believer that learning should never stop. No one is perfectionist, No one can learn everything, but one must keep on trying hard to learn new things/trend/technology.
On my personal learning index, 2018 was focus on building base for AWS similarly 2019 went for building base for GCP. I have Azure practitioner since 2012, therefore for last few years on Azure i have moved focused from traditional IaaS to PaaS/CICD as well as Data/AI.
Learning is of no use if we don’t apply in day-to-day life. Thanks to my job, where i get almost every requirement as new requirement. Thus, every solution i build not only allow me to use my learning but also push me further to explore and learn more.
I have tried to collate my learning KPI which i have achieved in last year 2019. Using this as based, i shall move forward in 2020. Like in sales target will keep on increasing YoY or QoQ, similarly self-target be it learning or knowledge should keep in increase.
Azure
AWS
GCP
TOGAF
Platform utilized for learning and off-course a ton of native documentation read (nothing beats that)
Linux Academy, Microsoft Learn, EDX
Linux Academy, EDX, AWS Quickstart
Linux Academy, Qwiklabs, Coursera,
Togaf Online Guide, Udemy course on Togaf
Unique Course Focuses
Designing and Build IOT Solution, Security, DevOps
Developing Solution on AWS (PaaS side), DevOps (CICD using AWS native)
More of day to day Practice learning, specially ADM Guidelines & Techniques
Boot-camp Attended
SAP HANA on Azure (onsite) Designing & Building AI Solution using Azure Cognitive Services
First focus was building base
Certification Achieved
AZ 300 AZ900 AZ103
GCP-PCA,
Togaf 9
Next Steps for 2020
AZ 301
AWS 2 Specialty (prefer Security and Networking)
GCP-Network Professional (this one already failed once & clueless why despite 100% sure on 84% answers) and Security
Enhance Practicality of Togaf in daily operation
My personal favorite has been and will always be ‘labs‘. Unless you get your hands dirty in implementing the solution, you can not learn from Online course or documentations. Thus, i chose platform to learn which can give me lot of labs to performs.
Such matrix help me to keep me laser focused on goal. In fact, i have built a mind-map chart which also helps me to build my learning path without focusing too much too many things.
At last, I am not at all firm believer of certifications. But, unfortunately on this basis, this is what Industry recognize you as expert, only after you are certified on xyz with abc specialty. Therefore, it is wise to have these badges but do not compromise on true learning/knowledge.
I tried to collate things and share it with you all as an experience so that you may try to replicate something similar for your learning journey. Most of you may be already expert on domain, thus find it very basic but it might be helpful for someone which may have not started such journey yet.
Last Holiday, I spent in getting hands dirty bout IOT, Edge, Analytics. This extended weekend, I decided to brush up my skills again on Cloud core component i.e. ‘Networking’.
SDN (software defined networking) is the backbone of any cloud platform. Whoever makes it simple to use/manage/secure is the king of cloud platform. This is why AWS is having advantage till now on cloud platform. Azure is definitely maturing day by day, in fact some area they are now leading like simplifying ‘Resource Group’ based design, SLA are ExpressRoute/VPN level, having their own network backbone across regions.
This time, I tested scenario where I was having three different VPC in AWS, all of them running for different purpose.
VPC1: My core production workload running
VPC2: Supported workload for my core production working like internet facing, file share etc.
VPC3: My management environment where I as syops/devops only have access.
Ask for environment;
VPC1 should not be explicitly allowed access to VPC3 or VPC2, even SysOps/DevOps operation should be restricted and should not have explicit access at all.
VPC 3 should not be explicitly allowed access to VPC2.
Having limited or negligible connectivity among all VPCs
Mechanism to have secure access for sysops without opening or bringing them on network. Option to record their access.
Solution;
Three VPC with different CIDR, obviously we can’t have CIDR overlap (basic thumb rule) if we want to establish some level of connectivity among them or establish hybrid networking
Every VPC having their own Subnet
Each VPC Subnet having their our Route Table, defining clear communication between source and target;
VPC: 10.1.0.0/16
Subnet: 10.1.0.0/24
Route table:
Route Table 1
Destination: 10.1.0.0/16
Target: Local
Route Table 2 (if public subnet)
Destination: 0.0.0.0/0
Target: igw (internet gateway of their respective VPC)
Security Group
Between VPC1 and VPC2, build VPC Peering. In AWS, building this is very simply. Few clicks under Peering connection under VPC section, defining requester and acceptor, authorization. What is more important post peering is updating ‘Route Table’ w.r.t. Communication flow to Target via Mode.
Example: VPC 1 (10.1.0.0/16) talking to VPC 2 (10.2.0.0/16)
Route table post Peering should be updated as
Destination: 10.2.0.0/16
Target: peering connection id (pcx)
Vice versa from VPC 2 to VPC1
If we do one side only then connectivity would be only one way
Interestingly we could have used VPC Peering between VPC 1 and VPC 3 again. But, is this wise or practical? Because most often in enterprises, Sysops/DevOps would be performed by group of people/team/vendors. Customer wants to give limited access, want to monitor how connections, how much traffic, not to allow direct entry, secured access, allow to block access any point of time etc. To solve all this problem, ‘Client VPN Endpoint‘ is the best solution without compromising on security and open network even to service providers.
Build Client VPN Endpoint (CPVN) inside VPC which you want to give access from. Chose as CIDR which you can be way isolate and would not be require in future. More guidance is available on AWS Docs.
V Imp, you can’t proceed with it unless you have Client and Server Certificate in place. If you intend to use solution like ‘OpenVPN’ through which Bastion would connect, then it is must to create Server Key/Certificate and Client Key/Certificate prior proceeding with above steps. CVPN Endpoint can only allow secure authentication only if Secure TLS Certificate ARN used by the server. And to do this, you need to provision this prior using AWS Certificate Manager (ACM). It is long steps and probably I can cover with steps by steps in coming blogs.
After this, chose DNS and Transport protocol TCP and CVPN endpoint is ready.
Then, go to Association and ‘Associate’ it to the VPC which you want to connect i.e. VPC1. After this, modify security and again under Associations tab, apply Security group which is not default so that instance level security rule can be followed. At last, under Authorization table, Authorize ingress to destination VPC CIDR 10.1.0.0/16. Once active, we are good to go.
Basically, what we need to do create a subnet under VPC1 which will have CPVN endpoint which would authenticate against Client – Server based certificate authentication and allow only authenticated traffic via this path. Since VPN client is between, we can limit remote concurrent connection. Using CPVN endpoint, we can keep track/log of all access/activities in Cloud Trail.
Run command inside Instance where VPN client is going to work aws ec2 export-client-vpn-client-configuration –client-vpn-endpoint-id –output text>client-config.ovpn
After this modify the config file with your client certificate and key details so that when you run invole your VPN client such as OpenVPN it invokes against those.
All this done, when you try to connect VPC1 from VPC3 from Bastion Client via VPN instance and run command such as (sudo openvpn –config client-config.ovpn) you would notice that it gets connected using certificate authentication. Also inside your AWS management console you would notice number of connection, data transfer packet size etc. details.
You can see how Client VPN Endpoint is granting IP from CIDR assigned to it.
Inside Client VPN Endpoint you can notice connection Active any point of time and take action on top it.
In order you want to extend this connectivity VPC 2 also, then just ‘Authorize Ingress’ to VPC 2 CIDR 10.2.0.0/16 and if internet via VPC2 (like we do via NAT Gateway) add one more ingress 0.0.0.0/0. Also add route table for destination 10.2.0.0/16 with target VPC1 Subnet similarly for 0.0.0.0/0 for.
Tools Used;
Nothing works better than simple blank paper and pencil. Simulate your scenario, draw your flow, route then go inside AWS panel and replicate those. Or I may be old school boy 🙂
Terminal on Mac. It is best things since I switched and made things a lot easy than installing lot of dependencies and keep on updating sub-systems
Draw.io for designing final architecture
And obviously free tier of AWS environment.
Note: This is just a humble effort to learn and share knowledge. Should there be any suggest please feel free to drop me your message, so that i can look into those.