In a recent testing endeavour, I had the opportunity to explore multiple topologies for a Secured Azure Network Hub Spoke deployment. The primary focus was on establishing stringent traffic control and inspection capabilities, particularly through the utilization of Firewall devices. However, the complexity increased as the objective expanded to encompass multiple HUBs across different regions. The ultimate goal was to simulate a typical enterprise deployment, enabling central firewall teams to enforce policies across the entire landscape while granting regional teams’ control and operational autonomy over their respective traffic through dedicated firewalls.
Exploring Secure Azure Network Hub Spoke Deployments:
The project required careful consideration and planning to ensure the successful implementation of a secure and scalable network architecture. Here are the key highlights of this testing journey:
- Traffic Control and Inspection: The foremost objective was to establish comprehensive control and inspection mechanisms for all types of traffic, including both private and internet-bound. Firewall devices played a critical role in achieving this goal, enabling granular policy enforcement and traffic analysis.
- Multi-HUB Deployment: To mimic the complexities of a real-world enterprise setup, the deployment spanned multiple HUBs across different regions. This approach allowed for centralized control by the firewall team at the global level while empowering regional teams to manage and operate their respective traffic through dedicated firewalls.
- Centralized Policy Enforcement: The deployment aimed to create a robust framework that enabled centralized policy enforcement. By consolidating the firewall management and configuration at the central level, the organization could ensure consistency and adherence to security policies across the entire landscape.
- Regional Autonomy: Simultaneously, the design emphasized providing regional teams with the flexibility and autonomy to control and operate their traffic based on specific requirements. This decentralized approach allowed for efficient management within each region, while still adhering to the overarching security framework.
To streamline and accelerate my testing process, I utilized a combination of Terraform and GitHub Actions. Leveraging Terraform allowed for the rapid provisioning and clean-up of resources, contributing to cost savings. I have shared the patterns and corresponding Terraform and GitHub Workflow sample code in this repository
Some pattern, artifacts to accelerate your adoption on Azure Networking
The repository contains three distinct patterns that I explored:
- Virtual Network Hub-Spoke (Traditional Hub-Spoke): This pattern is widely recognized and commonly used. It follows the traditional Hub-Spoke topology that many of us are familiar with.
- Virtual WAN Route Through NVA (or NVA in Spoke): This pattern utilizes Azure Virtual WAN capabilities and involves the use of a Virtual Hub. However, in this configuration, the Network Virtual Appliance (NVA) is placed directly in the spoke, adjacent to the Virtual Hub. Subsequently, the nested spoke peers with the NVA VNet. The key advantage of this pattern is that customers can continue using their standardized NVA Appliance alongside Azure Virtual WAN’s global connectivity. It’s worth noting that Azure Virtual WAN now supports SaaS ISV integration within the Hub, as well as the inclusion of various third-party NVAs within the Secured Virtual Hub (Secured Virtual HUB refers to a Virtual Hub with a Firewall Device inside it, where the Firewall Device can be Azure Firewall or a supported third-party appliance).
- Virtual WAN Routing Intent: Secured Virtual HUB has been available for some time now, and with the introduction of routing intent, certain limitations have been addressed. Routing intent empowers organizations to establish simple and declarative traffic routing policies. In other words, it enables defining which types of traffic should be controlled via the Firewall. An added advantage is that it supports cross-region hub traffic, allowing for efficient management of network traffic across different regions.
Getting a Single Pane of Glass View Across the Landscape: Command Centre View: During my testing process, I encountered the need to review Azure Firewall Logs across multiple Azure Firewall instances in different regions. To address this requirement, I adopted a two-step approach:
- Enabling Diagnostic Logs using Azure Policy: To enable diagnostic logs on Azure Firewall instances, I utilized a custom diagnostic policy built by Azure Landing Zone. This policy facilitated the activation of diagnostic logs for various Azure resources and ensured their transmission to specific Log Analytics Workspaces. You can find the policy initiative here:(Github Reference here). For guidance on using this policy outside of the Azure Landing Zone construct, refer to this documentation (Github Reference for Custom Policy).
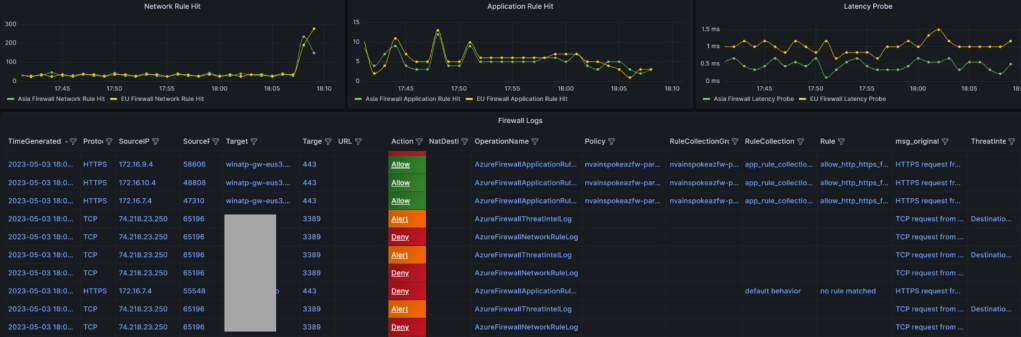
- Dashboard creation using Azure Managed Grafana (Guidance ): To visualize the logs that were landing in the Azure Log Analytics workspace, I leveraged the capabilities of Azure Managed Grafana to create a comprehensive dashboard. Considering my perspective as a member of the NOC/InfoSec team, I focused on key metrics and log visualizations that would be of interest to customers. The following are the key metrics and log streams I aimed to include:
- Application Rule Hit Count Across Firewalls: Since I was utilizing the Azure Firewall Parent-Child Policy concept (Base Policy and Child Policy), I wanted to observe the near real-time pattern of rule hits during testing. This allowed me to assess the effectiveness of the rules being applied.
- Network Rule Hit Count Across Firewalls: Given that I was testing communication between spokes within the same hub as well as between spokes in different hubs, I wanted to gauge the metrics related to network rule hits across the firewalls. This provided valuable insights into the network traffic patterns.
- Latency Probe Across Firewalls: Monitoring latency becomes crucial when operating under a secured environment. It is essential to keep a close eye on any latency probes that exceed the normal thresholds. By monitoring latency, I could identify potential performance issues and take proactive measures.
- Log Streaming with Key Indicators: While log streams can be overwhelming with textual data, adding eye-catching indicators can enhance their visibility. This is where Grafana Thresholds proved to be useful. By configuring the dashboard to display indicators for alerts, deny, and allow, I could quickly identify important log lines. Furthermore, I designed the column sequencing in a way that allowed me to capture the required information at a glance. Regular dashboard refreshes in Grafana ensured that I had up-to-date information.
Final Sample Visualization (refer repo mentioned above for JSON file for dashboard in Grafana and Respective IaC Code)
Note: Similar dashboard can be built using Azure Workbook. In fact, in some case Azure workbook comes out extremely power and offers amazing visualization/resource linkage (with even Icon/tree etc.). May be as next iteration, I can build and publish for Azure workbook too.